Want to Predict Tomorrow’s Stock Market? Watch Corporate Insiders Today.

By Allen Harris • May 23, 2022

It’s a fool’s errand to try and stick the landing and call the end of a bear market down to the exact day. Nonetheless, on February 7, 2022, this fool argued that there was a six-in-10 chance the stock market would bottom on May 22, 2022. I’m dying to find out if I’m right (or close to being right). If I am wrong, the stock market is in for a world of hurt. I assigned a two-in-10 chance that the stock market would drop 20% by September 2022. If the downdraft continues, in part, it will be because investors expect a hard landing from the Federal Reserve raising interest rates. Note that I said “hard landing” and not a recession.
I think the U.S. economy is in a recession right now. It’s just not a recession that “feels” like a recession because jobs are plentiful. (Unfortunately, the labor market is beginning to reveal early signs of weakness, but more on that shortly.)
Admittedly, the economy is not in a recession based on traditional definitions. However, Gross Domestic Product (GDP) is flatlining, housing (and so much more) is costly, and we can’t get our babies the formula they need. So, I’m going to call it a recession, even if it isn’t technically one. Given the mildness of the recession, the stock market has suffered enough in terms of magnitude and duration to have completed its correction.
I expect, at least, a so-called summer rally. However, mid-term elections almost always suck the air out of the stock market. So, even if the rally starts the day after this column is published, the market might have to digest political considerations. When significant elections approach, investors with political ideologies often sell stocks in anticipation of the other party ruining the world as we know it. (It sounds like I’m a cynical wise guy, but I am being serious.)
When the Cost of Money Goes Up, the Price of Stocks Goes Down
(Nerd Alert: You might want to just skip the following three paragraphs). I frequently get pitched by private companies looking for an angel investor. An angel investor is an individual who puts up the capital for a startup in exchange for equity. I love the concept, but there are two problems. First, business owners believe their company is worth way more than it is. Second, higher interest rates are dragging down the multiples I want to pay on expected earnings. (For the sake of simplicity, I am going to use the terms “interest rates,” “discount rates,” and “cost of money” interchangeably in this passage. I know it’s not mathematically perfect, but I’m trying to avoid laying this out as a textbook.)
When a startup asks me for a pitch meeting, they typically show me a 5-year, pro-forma profit and loss statement. Year one is almost always zero or near-zero profit. And then years two-to-five show aggressively forecasted earnings. A few years ago, assuming those forecasts to be correct, a discounted cash flow (DCF) analysis would reveal some of those investments to be rather tempting.
Discounted cash flow analysis is a method of valuing a company considering the time value of money. In other words, the present value of a business depends on its cash flow over time. Part of the DCF model is the “discount rate.” When interest rates rise, cash flows become worth less today and exponentially less the farther out cash flows (or earnings) are collected.
(Nerd off.)
Even if a company’s earnings don’t change, higher interest rates drive down the multiple an investor might be willing to pay. We see that first-hand, with some of the most significant price drops in the stock market to companies with no earnings or the most considerable funding needs.
If the stock market rallies hard from here, those particularly beaten-down stocks may enjoy a tremendous oversold bounce. However, as I’ve been suggesting for a year now, shifting from some growth stocks toward value stocks seems appropriate. After all, some of the growth of those growth companies requires massive funding injections. And some of those same companies don’t expect near-term profitability even as revenues rise. That means sophisticated investors may not be willing to pay higher multiples to own growth stocks because of the long duration required to collect cash flow. Instead, investors should find their way to good old-fashioned, tried-and-true, predictable, dividend-payers.
If fun-with-math isn’t your thing (and who could blame you?), then here’s some fundamental information you haven’t seen in the headlines yet. The pace of layoffs in the technology sector is heading toward levels not seen since the early months of the COVID-19 pandemic. During the pandemic, layoffs at tech companies were running at about 10,000 per week. According to layoffs.fyi, which tracks layoffs in real time, layoffs at tech companies have recently been about 5,000 per week. We’re just beginning to see this in the broader economy.
Jobless claims are a data point that refers to the claims for unemployment benefits filed by unemployed individuals. Jobless claims bottomed at 166,000 on March 18, 2022. Claims have jumped back up above the 200,000 level.
There is an argument that some individual tech companies are now priced fairly. However, I will likely continue flattening out my technology sector allocations. This will reduce exposure to unprofitable companies and companies that rely on future years of earnings to justify valuations.
Insider buying points to confidence within corporations
We’ve recently seen insider buying pick up. It’s often a bullish signal when corporate executives invest in shares of their own company. Recently, the CEOs themselves are stepping up.
According to VerityData, we’ve seen spending of $1.4 million in General Motors, $5.3 million in Uber, $9.5 million in Charles Schwab, $10 million in Shopify, and $50 million in Spotify by CEOs of their respective companies. Insider buying is a sign that those in the know have confidence in their expected cash flow.
To be balanced, there has also been a lot of insider selling. However, it’s hard to say why sales occur — financial planning, tax payments, reducing single-stock overweight, or purchasing a villa in the south of France. However, if an insider buys, it’s only because they expect a rise in the stock price.
Insiders are “in the know.” But what of outsiders who are just plain smart enough to know without being on the inside? What are they buying? Some folks refer to this as “whale watching.” Two of my favorite whales are Berkshire Hathaway (the company headed by famed-investor Warren Buffett) and David Tepper (a consistent hedge fund manager). Berkshire Hathaway is picking up shares of Citigroup, Ally Financial, Celanese, Markel, and Paramount Global. Tepper added Amazon, Uber, and Microsoft. Both parties sold some positions, but the point is that these whales are finding this an opportune time to buy stocks, not hide in the bunker. The so-called “Smart Money” is buying.
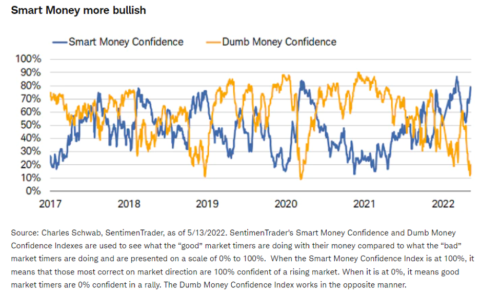
Smart Money is capital controlled by insiders, market mavens, central banks, institutional investors, and I’d argue, Capital Ideas readers. Per the above graphic, Smart Money is confident that it’s a good time to put cash to work in the market. As a contrarian, I am weary of crowds at extremes. The crowd is the so-called “Dumb Money.” Dumb Money is nearing one of its lowest readings in decades.
What if the stock market continues to drop?
If May 22, 2022, isn’t the bottom, I think there are two ways I could be wrong.
The price-to-earnings (P/E) ratio of the S&P 500 index was about 21 at the end of 2021. Currently, the P/E is about 17. That seems about right to me in terms of a price adjustment. However, valuations do tend to be poor timing tools. Let’s say I am wrong, and the market overshoots and brings down its P/E to its longer-run P/E average of 15. That means the market would drop about ten percent lower than it’s fallen so far.
(FYI, according to Bank of America calculations, the P/E of the Russel 2000 small-cap index is about 12, which is twenty percent less than its historical average.)
Another way I could be wrong is if the economy does suffer that hard landing. In that case, I suspect that the market’s drop will be more like the typical bear market – an average drop of 35.6% for the S&P 500.
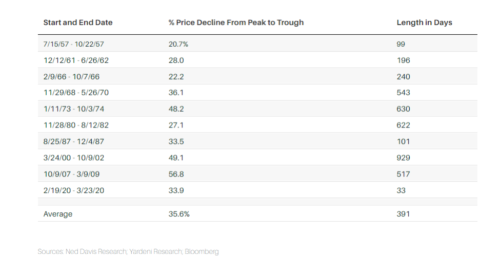
In this graphic, we see the performance of the S&P 500 index for the ten most recent instances in which the index declined by 20% or more. If the market drops 21%, there is nothing magical in that it must fall more. However, when it drops that much, it’s a sign that the economy is fragile enough that the next big thing can push the economy into despair (and the stock market with it).
I think the market is pretty fragile currently, which is why I have shifted from some higher-beta growth stocks to more predictable value stocks. If the bounce (that I hope) we get from here looks as if it’ll only be a summer rally, I’ll be inclined to continue that reallocation.
And if we don’t get that recovery I expect? May the market gods have mercy on our souls.
Allen Harris is the owner of Berkshire Money Management in Dalton, Massachusetts, managing investments of more than $700 million. Unless specifically identified as original research or data-gathering, some or all of the data cited is attributable to third-party sources. Unless stated otherwise, any mention of specific securities or investments is for illustrative purposes only. Adviser’s clients may or may not hold the securities discussed in their portfolios. Adviser makes no representations that any of the securities discussed have been or will be profitable. Full disclosures. Direct inquiries: aharris@berkshiremm.com.
This article first appeared on The Berkshire Edge May 23, 2022.

Allen is the CEO and Chief Investment Officer at Berkshire Money Management and the author of Don’t Run Out of Money in Retirement: How to Increase Income, Reduce Taxes, and Keep More of What is Yours. Over the years, he has helped hundreds of families achieve their “why” in good times and bad.
As a Certified Exit Planning Advisor, Certified Value Builder, Certified Value Growth Advisor, and Certified Business Valuation Specialist, Allen guides business owners through the process of growing and selling or transferring their established companies. Allen writes about business strategy in the Berkshire Eagle and at 10001hours.com.
Similar Posts
-

Recession or Not? Analysis by Allen Harris, October 2022

By Allen Harris
October 12, 2022 -

Unpopular Opinions in the Face of a Bear Market
By Allen Harris
June 22, 2022 -

S&P 500 Spiked 6.58% at June Rally | Impact on Index & Moving Averages
By Allen Harris
June 6, 2022