The ‘Fed Put’ is Dead

By Allen Harris • January 24, 2022
“Is this it? Is this the start of a 10-15 percent correction?” asked Dana, a client of mine. At the time of the question, the S&P 500 was down just about 5 percent from its recent high.
Trying to sound empathetic and not cavalier, I shrugged and said, “Maybe.”
I gave her the stats — that type of garden-variety, 10-percent correction happens about every year-and-a-half. The last such drop was 16 months ago. So, sure, we’re “due” for a correction. Following each previous such stock market decline, prices returned and achieved higher highs. Stock prices have been able to do so because the U.S. economy is vibrant and dynamic, and long-term investors know to buy stocks when they get cheaper.
But as I thought about it further, I said to Dana, “…maybe it’ll be more.”
The yield on the 10-Year Treasury was 1.4 percent in December 2021. A month later, it cracked 1.8 percent. On a relative basis, that’s a big jump.
The sell-off in Treasury bonds — sending yields higher — has been blamed on the expectations that out-of-control inflation will trigger the Federal Reserve to raise interest rates aggressively. Those higher interest rates would be a tool to slow down the economy, which should curb inflation.
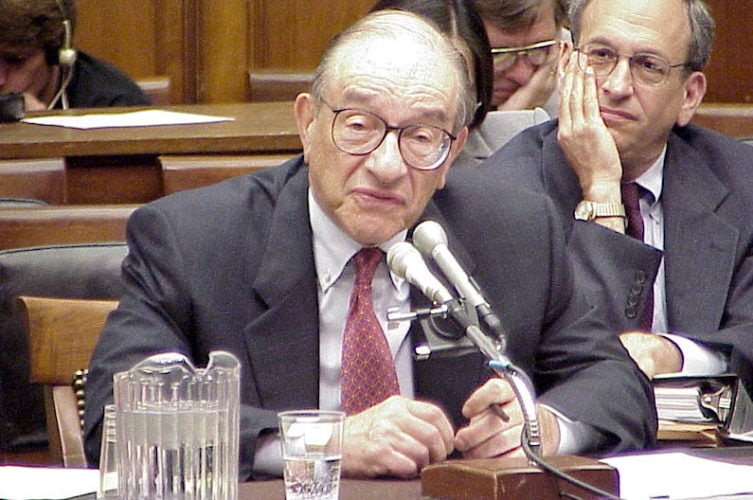
The Fed is going to fight inflation. That’s a given, as it’s their mandate. The Fed’s other directive is to maintain economic growth. For decades, the joke has been that the Fed’s silent third mandate is to keep the stock market up. In fact, under Federal Reserve Chairman Alan Greenspan, it was known as the “Greenspan Put.” Investors have observed that the Fed’s reactions to price volatility appear to provide evidence that the Fed would backstop the stock market. As a result, investors have often been prone to excessive risk-taking, thus pushing asset prices higher.
But it might be more of a reality than a joke. In June 2020, the authors of “The Economics of the Fed Put” updated their study. As in their 2017 original, they expressed that a lower stock market can predict the Fed’s use of monetary policy; the Fed would cut rates, which propped up stock prices.
If you think about it, keeping asset prices high was true to its mandate. If the Fed wanted to keep the economy stable, they had to control the stock market. However, now the Fed doesn’t care about the stock market.
“Had to” — past tense.
The Fed needs to slow the economy to fight inflation; ergo, the Fed doesn’t care about the stock market. The Fed will have a higher tolerance for the stock market going down because its goal is to slow the economy down. If the fear of higher interest rates sends stocks down, the Fed will consider it a job well done.
Dana might be onto something.
Death Cross
The dreaded “Death Cross.” Sounds ominous, right? Since I was a young lad, investors have feared it. The Death Cross is a technical chart pattern that indicates the potential for a major sell-off. Even larger than the one Dana fears.
Don’t get bogged down in the wonkiness of the definition here. The Death Cross occurs when the short-term average price of a stock or index (usually 50 days) moves below its long-term average price (usually 200 days).
On January 19, 2021, the Russell 2000 small-cap index experienced the dreaded Death Cross. This was its first since the spring of 2020.
As Dana and I discussed, every previous stock market correction (and, yes, crash) has been followed by higher stock prices. But in a world where the Fed put is gone, should we ignore this warning?
Ignore? No. Take with a grain of salt? Perhaps.
According to the good folks at Bespoke, there have been 20 previous Death Crosses for the Russell 2000 when — and this is important — a Death Cross had not occurred to the index in the prior years.
Death Crosses have traditionally been feared as terribly negative technical formation. However, according to Bespoke’s calculations, returns have been positive more often than negative three, six, and, 12 months after the Death Cross occurred. The average returns aren’t necessarily exceptional, but they’re good enough to make my life more difficult. This week has brought some mixed signals. Last week, I revealed that I made some additional portfolio changes to prepare for higher interest rates. My small-cap exposure is currently relatively minimal (my most aggressive portfolios have about a 10-percent allocation.) I have not made any changes to my small-cap allocation as I submitted this column, but doing so is on my radar.
Allen Harris is the owner of Berkshire Money Management in Dalton, Mass., managing investments of more than $700 million. Unless specifically identified as original research or data-gathering, some or all of the data cited is attributable to third-party sources. Unless stated otherwise, any mention of specific securities or investments is for illustrative purposes only. Adviser’s clients may or may not hold the securities discussed in their portfolios. Adviser makes no representations that any of the securities discussed have been or will be profitable. Full disclosures. Direct inquiries: aharris@berkshiremm.com.
This article appeared originally in The Berkshire Edge on January 23, 2022.

Allen is the CEO and Chief Investment Officer at Berkshire Money Management and the author of Don’t Run Out of Money in Retirement: How to Increase Income, Reduce Taxes, and Keep More of What is Yours. Over the years, he has helped hundreds of families achieve their “why” in good times and bad.
As a Certified Exit Planning Advisor, Certified Value Builder, Certified Value Growth Advisor, and Certified Business Valuation Specialist, Allen guides business owners through the process of growing and selling or transferring their established companies. Allen writes about business strategy in the Berkshire Eagle and at 10001hours.com.
Similar Posts
-

Recession or Not? Analysis by Allen Harris, October 2022

By Allen Harris
October 12, 2022 -

Unpopular Opinions in the Face of a Bear Market
By Allen Harris
June 22, 2022 -

S&P 500 Spiked 6.58% at June Rally | Impact on Index & Moving Averages
By Allen Harris
June 6, 2022