I feel lousy

I feel lousy. That’s probably good news for the stock market.
I am what the financial industry calls a “contrarian,” which is to say that when everyone is buying, I look to sell. And when everyone is selling, I try to find things to buy.
That’s oversimplifying it, but you get the picture.
But what does it mean when everyone is buying? Again, oversimplifying it, peak buying reflects optimism. Everyone who wants to buy has done so because they’re confident prices will rise.
And when everyone is selling, people believe prices will drop further, so they feel as if they must dump them at any price they can get. Feel. That’s an important word I just used.
On more occasions than I can count (because I’m not good at math), people have said to me, “Oh, you’re a professional investor — you must be good at math.” Well, I’m a whiz with a calculator, but no. I could brag about getting an “A” in calculus in high school. However, you use it or lose it. Today, I’m confident that any freshman could finish multiplying a set of binomials before I even sharpened my No. 2 pencil.
It doesn’t much matter. Investing doesn’t require a deep level of mathematical understanding. True, there are some sophisticated algorithms out there trying to track down and capture price swings in stocks to jump on that momentum before they peter out. But that’s a tool to trade, not invest. I’m not denigrating day trading; it just isn’t my bag. There’s way too much empirical evidence about how people routinely try it and fail (depending on your definition of “fail,” I suppose). I know that I’m not the exception to the rule, so I stick to what I know.
The point is, at extremes, people buy or sell stocks because of feelings, not because of mathematics. Math (even for those of us who need to use calculators) is super easy. Figuring out when people feel so lousy about the stock market that it’s beneficial for stock prices is complicated.
You see, the price of anything depends on the Law of Supply and Demand. And when everyone feels despondent about the market’s direction, everyone who will sell makes those sales. In other words, supply flooded the market and drove down prices. Once everyone has sold, Supply has stopped expanding. At that point, prices would have been driven down far enough for other investors to demand holding those stocks.
Ironically, I use (simple) math to determine how lousy people feel. And people are feeling rather bleak.
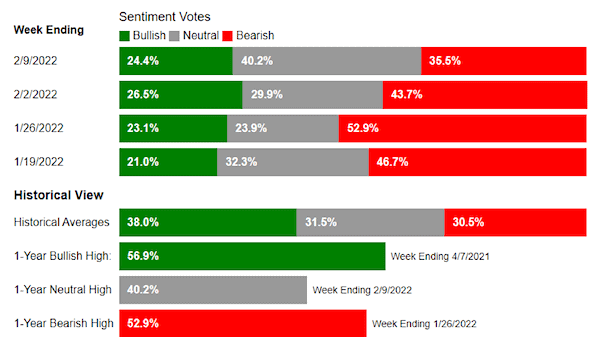
According to the American Association of Individual Investors (AAII), the number of market bears (those who feel that stock prices will drop) is well above the historical average. Like me, sentiment surveys are contrarian, meaning that a more bearish reading is a positive sign for equity prices in the months ahead.
What Direction Do AAII Members Feel the Stock Market Will Be in the Next 6 Months?

Bearishness is coming off its lows, signaling that the low for stock prices may be behind us. As you can see in AAII’s chart above, the number of bears hit a 52-week high of 52.9 percent for the week ending January 25, 2022. That was its highest reading since April 11, 2013 (54.5 percent). The reading of 52.9 percent marked the 10th consecutive week the number of bears was above its historical average of 30.5 percent.
While this is good news, it’s not the best news. This was still only the 41st-highest reading of bearish sentiment in the survey’s history. As with any single indicator, you cannot rely on it entirely. However, this indicator is a pretty good affirmation to me that my predictions from last week about when the stock market will bottom are rather solid. Enough damage has been done to our collective psyche to suggest that whatever additional pain we might experience in the months ahead will be temporary.
Don’t get too encouraged. As I said, it’s good news, but not the best news.
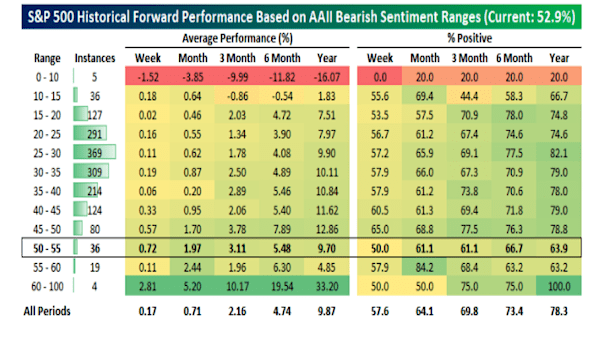
According to Bespoke, the bulk of readings for bearish sentiment cycles have fallen between 20–35 percent.

There have only been 59 weeks with bearish readings above 50 percent since the start of the survey in the 1980s. After bearish readings between 50–55 percent, the average gains for the S&P 500 have been in line with all other periods for the stock market. That’s good news. On average, the stock market has provided us with some excellent returns. However, the number of times the gains were positive has been substantially fewer than in other periods. Know what that sounds like to me? Last week, I said there was a 2-in-10 chance the stock market would drop about 20 percent by the autumn of 2022. It sounds to me like that might happen. The stock market could get slammed, then rally in the last couple of months of 2022 and into 2023. But we might need more than one year to repair all the damage we might experience in the months ahead.
Let’s end on good news — whatever additional level of “lousy” we might experience this year should be temporary. I expect much better things on the other side of it.
Some trades
Actually, let’s end on some recent trades I made.
In July 2020, I sold some of my small-cap and homebuilder stocks to make room to buy into the Dow Jones Industrial Average. A month ago, I bought into some financial stocks. Last week I swapped out the remaining allocation of a home builder ETF to buy more financial stocks.
Allen Harris is the owner of Berkshire Money Management in Dalton, Massachusetts, managing investments of more than $500 million. Unless specifically identified as original research or data-gathering, some or all of the data cited is attributable to third-party sources. Unless stated otherwise, any mention of specific securities or investments is for illustrative purposes only. Adviser’s clients may or may not hold the securities discussed in their portfolios. Adviser makes no representations that any of the securities discussed have been or will be profitable. Full disclosures. Direct inquiries: [email protected].
This article appeared originally in The Berkshire Edge on February 14, 2022.
Allen is the CEO and Chief Investment Officer at Berkshire Money Management and the author of Don’t Run Out of Money in Retirement: How to Increase Income, Reduce Taxes, and Keep More of What is Yours. Over the years, he has helped hundreds of families achieve their “why” in good times and bad.
As a Certified Exit Planning Advisor, Certified Value Builder, Certified Value Growth Advisor, and Certified Business Valuation Specialist, Allen guides business owners through the process of growing and selling or transferring their established companies. Allen writes about business strategy in the Berkshire Eagle and at 10001hours.com.


