CAPITAL IDEAS: Do you have excess savings?

By Allen Harris • March 1, 2021


The U.S. Gross Domestic Product (GDP) has almost recovered from its pandemic loss. According to JP Morgan, the last GDP calculation was merely 1.3 percent less than its February 2020 peak. According to the Atlanta Fed’s GDPNow forecast, the U.S. economy will surpass its pre-COVID-19 peak this quarter.
With the caveat that we’re only about two-thirds of the way through and anything can happen in a month (remember March 2020?), the Atlanta Fed’s model currently forecasts a 9.6 percent growth rate of GDP for the first quarter of 2021.
Unfortunately, that sounds better than it is. The official unemployment rate of 6.3 percent masks some deplorable economic conditions. According to data from the Bureau of Labor Statistics, and as the Federal Reserve chairman testified on February 24, when the numbers are adjusted for workers dropping out of the labor force, the unemployment rate is 9.9 percent. That rivals the levels at the depth of the Great Recession. The distribution of economic growth has favored far too few.
Before COVID-19, U.S. households typically held a predictable ratio of checkable deposits relative to the GDP. That ratio was about 10 percent. Given that the U.S. GDP is about 21.4 trillion, we should expect the amount of checkable deposits to be about $2.14 trillion. It’s not. According to Oxford Economics, it’s about $3.7 trillion. That’s $1.6 trillion of “excess savings.”
The amount of actual savings over expected savings is called “excess savings.” To Main Street America, the concept of having excess savings sounds silly. The Wall Street concept is that we should expect a revision to the mean. The current ratio of checkable deposits to GDP is about 17.3 percent. According to economic theory, we should expect U.S. households to spend down that $1.6 trillion of excess savings to get back to the 10 percent average ratio of savings-to-GDP.
The distribution of excess savings is lopsided, with more advantaged households making up the bulk of the savings. In contrast, poorer families have seen their savings decline. Oxford Economics estimates that the top two quintiles of U.S. households own all the excess $1.6 trillion of savings.
The bottom three quintiles should expect to see a boost if the Biden administration can pass its proposed $1.9 trillion spending relief package, the American Rescue Plan. That would be on top of the $920 billion stimulus bill signed by Congress in December 2020. That package will provide a $300 weekly supplement for unemployment insurance, as well as $600 direct payments to individuals.
Where will all this money go? The Peterson Institute for International Economics (PIIE) pulled data from the Bureau of Economic Analysis (BEA). Their following graphic suggests there is lingering demand for elective health care, travel, leisure, and restaurants.
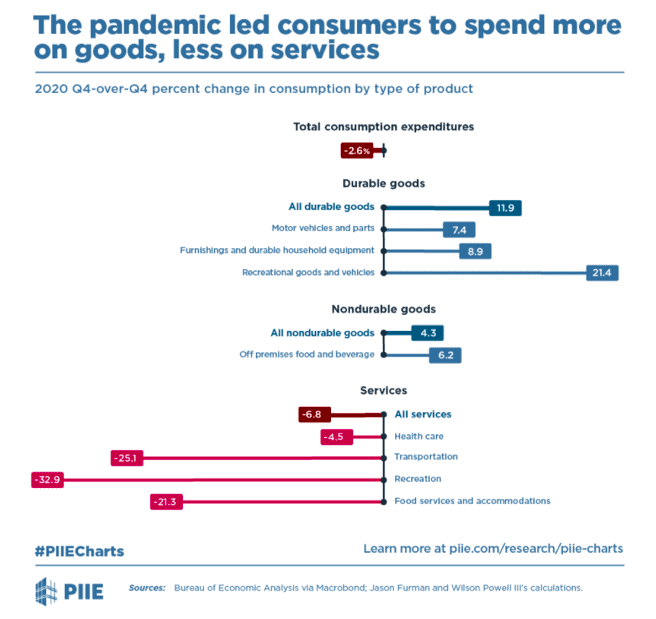
History suggests the savings rate can quickly fall back to pre-crisis levels. However, the pandemic makes it difficult to gauge when savings might be reduced. COVID-19 is limiting the ability of consumers to spend on many services. The speed at which those savings will be converted into expenditures depends in part on the pace of the COVID-19 vaccination program (which is getting easier to track). However, spending conversion will also rely on how comfortable people become in resuming pre-COVID-19 activities and how much governments will loosen restrictions. Both of those are very hard to predict.
That $1.6 trillion of excess savings is the secret stimulus that no one is talking about. It’s one of the reasons I am not more defensive in my portfolios. But, boy, am I thinking about it.
I have a thought, but no science to support it. There’s no mathematical data or secret technical indicators scrawled across a whiteboard to share with you. But, in my gut, I feel as if we’re on the precipice of a market dip. How big might it be?
According to Cornerstone Macro, there have been seven dips in the S&P 500 since the March 2020 low. The median and average declines have been similar, at -7.19 percent and -7.07 percent, respectively. The range has been -3.7 percent to -10.6 percent. Charting trend lines, Cornerstone Macro uses technical analysis to predict that the next drop will be limited to about a 6 percent correction if it were to start at these levels, which is toward the low end of the 5-15 percent range I have been expecting.
The prediction of a 6 percent drop is perfectly rational. I fear the fall will approach the high end of my range. A 15 percent correction would bring the S&P 500 roughly to its 50-day moving average. That, too, would be a rational expectation. Rational, but not fun.
I’ve informed readers that, instead of proactively trying to time a correction, I’d use a significant enough correction as an opportunity to move into domestic small-cap stocks and emerging market stocks.
Admittedly, I’m not as brave as I make myself out to be. On February 8, 2021, I let readers know that I rebalanced one of my portfolios and took a 6 percent position in the buffer fund “BFEB.” It’s not a big position, but it’s reflective of my concern that a correction is coming. However, ultimately, whether it’s a 5 percent pullback or a 15 percent pullback, I would consider it an opportunity and not a problem.
Allen Harris is the owner of Berkshire Money Management in Dalton, Mass., managing investments of more than $600 million. Unless specifically identified as original research or data-gathering, some or all of the data cited is attributable to third-party sources. Unless stated otherwise, any mention of specific securities or investments is for illustrative purposes only. Adviser’s clients may or may not hold the securities discussed in their portfolios. Adviser makes no representations that any of the securities discussed have been or will be profitable. Full disclosures. Direct inquiries: aharris@berkshiremm.com.
This article originally appeared in The Berkshire Edge on March 1, 2021.

Allen is the CEO and Chief Investment Officer at Berkshire Money Management and the author of Don’t Run Out of Money in Retirement: How to Increase Income, Reduce Taxes, and Keep More of What is Yours. Over the years, he has helped hundreds of families achieve their “why” in good times and bad.
As a Certified Exit Planning Advisor, Certified Value Builder, Certified Value Growth Advisor, and Certified Business Valuation Specialist, Allen guides business owners through the process of growing and selling or transferring their established companies. Allen writes about business strategy in the Berkshire Eagle and at 10001hours.com.
Similar Posts
-

Recession or Not? Analysis by Allen Harris, October 2022

By Allen Harris
October 12, 2022 -

Unpopular Opinions in the Face of a Bear Market
By Allen Harris
June 22, 2022 -

S&P 500 Spiked 6.58% at June Rally | Impact on Index & Moving Averages
By Allen Harris
June 6, 2022