CAPITAL IDEAS: A bubble in ‘stonks’

By Allen Harris • February 22, 2021

COVID-19 vaccination update
The good news: COVID-19 cases and hospitalizations have improved recently in the U.S. As of February 15, 2021, 54.6 million doses have been given. An average of 1.64 million doses per day are being administered.
The bad news: Infections of the more contagious variant from the U.K. are doubling every 10 days in the U.S. This mutant strain may reverse the positive trends that have occurred since January 9, 2021. More infections would slow the reopening of the economy and be a headwind for job creation.
Retail trading: Froth and frenzy
Retail investors are bidding up so-called “meme” stocks with seemingly reckless abandon.
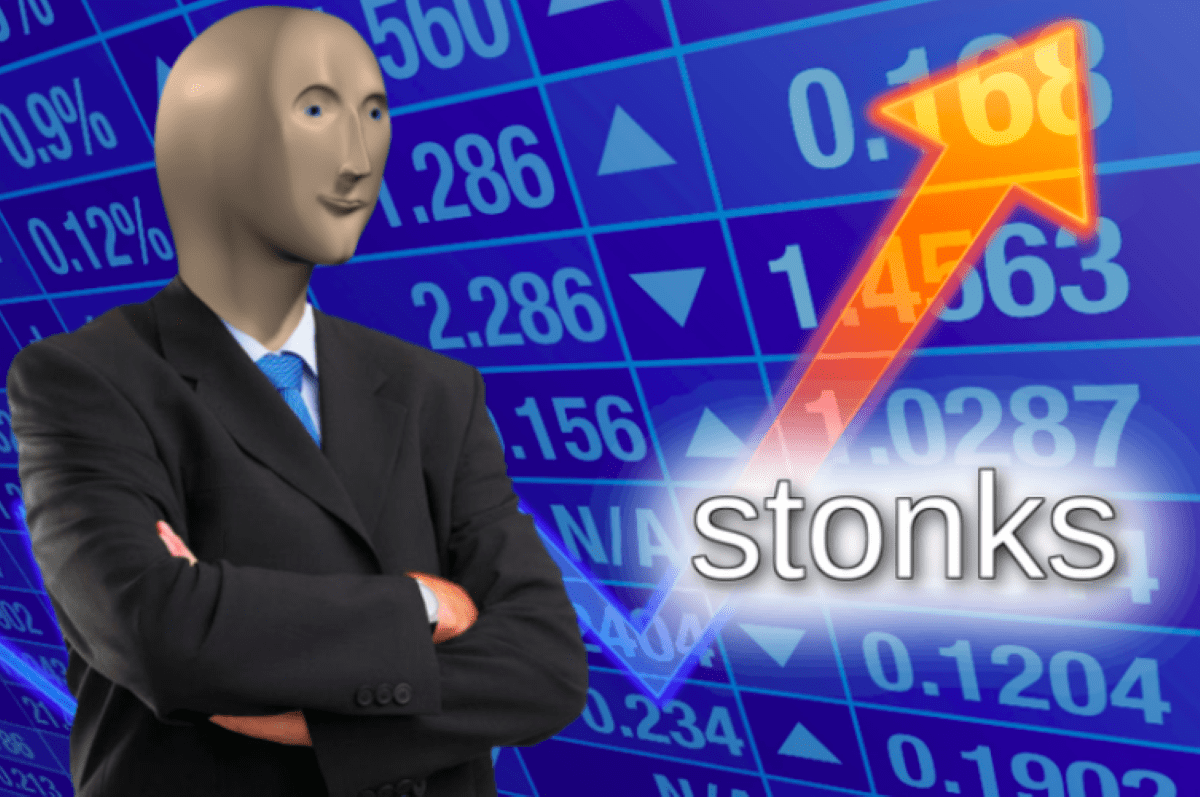
What does stonks mean?
Meme stocks, also called “stonks,” are the stocks that are popular with millennial-aged retail traders. It is argued that the prices of stonks move more based on hype than on changes to the company’s fundamentals. Some of those meme stocks reached bubble territory. Bubbles are dangerous because a rippling effect can cause a severe contraction of asset prices more broadly when they burst.
Are bubbly stonks a sign of a broader market top? Well, first, let’s consider there are always some signs of froth out there. Froth refers to market conditions preceding an actual market bubble. In either case — froth or bubble — prices are detached from their underlying intrinsic values and have risen to unsustainable levels.
In recent weeks, the media has increasingly focused its attention on those meme stocks, some of which doubled (or more) in price over short periods. Those rapid price increases seemingly have been based on comments on the Reddit subforum “Wall Street Bets” and Twitter’s StockTwists, inciting Robinhood investors to snap up shares of the most chatted-about stocks.
The fact that froth exists is not as meaningful as its prevalence. The aggregate market capitalization of the meme stocks is a small percentage of the overall stock market. Due to that relative size, I am not scared of it permanently taking down the stock market. I don’t see the meme stock bubble threatening anything more than a run-of-the-mill 5-15 percent correction to the stock market.
And, yes, 5-15 percent is a wide range. The point isn’t to be too precise in the magnitude (because that’s an impossibility). The effort is to determine if any pullback will be much larger or last much longer. If we expect a correction to be significant, we could get defensive. If it were expected to last long, we could collect dividends and interest as we wait. I don’t think it’ll be that long — maybe a few months, but not a few years.
I suspect investors would like to be invested in the stock market but continue to miss entry points. Retail investors have actually pulled out $50 billion of equity funds in January 2021, according to DataTrek Research. That compares to $121 billion of inflows into fixed-income funds. And that’s not merely a recent occurrence. According to Fundstrat, since 2009, only 4 percent of the $3 trillion of fund inflows have gone into equities. Before 2009, previous decade-long streaks saw closer to half of the fund inflows going to equities.
Some people aren’t as invested in the stock market as you and I are. And the more people come to expect improvement in the economy and the path of COVID-19, the more likely they are to experience the fear of missing out (FOMO) on higher stock prices. I suspect that gaps down in stock prices will nudge investors to put money into that FOMO trade. FOMO should keep the stock market from falling much more than a 5-15 percent pullback. However, I am not ruling out something similar to the three-month, 20 percent drop of the fourth quarter of 2018.
In previous columns, I’ve written about how stock markets tend to revert to the mean. For the S&P 500 to pull back to its 50-day moving average, it would have to drop about 15 percent, the high end of my 5-15 percent range of an expected drop. However, it’s not uncommon for the stock market to vacillate on either side of its 200-day moving average, which would require the S&P 500 to drop over 25 percent to get below that line.
The Power of FOMO
I want to acknowledge, once again, that I am a contrarian. That means, to oversimplify it, if the crowd is selling, I want to be buying. If the crowd is buying, I want to be selling. However, I also acknowledge that an overvalued market can get more expensive. It’s what the stock market does so long as economic and earnings expectations continue to improve.
Usually, if people are buying stocks, that means they are optimistic. Buying stocks is a measurement of optimism, and that’s often my signal to get defensive in my portfolios. However, this time the action of buying (or lack thereof) is not matching the optimism.
The exuberance of investors (which I’ll detail below) suggests that a correction is coming. Investors’ FOMO power indicates that whatever selling comes our way will be met with investor buying (if all else remains equal in the economy). That interest in buying should limit the pullback’s duration and magnitude.
Typically, investors value protecting the money over making more. That’s why selling is often met with more selling, as investors react by liquidating their investments out of fear of losing more money. However, when overly optimistic, they overlook the risks, which is why a pullback might be considered an opportunity.
The CBOE Volatility Index (a k a, “the VIX,” a k a the “fear gauge”) supports my theory. On Friday, Feb. 12, 2021, the VIX dropped below 20 for the first time since the stock market began its sell-off in February 2020. The drop of the VIX below 20 is what traders refer to as a “risk-on” signal. A risk-on signal means that algorithmic traders and other large players might buy more stocks because market fears are receding. According to Fundstrat, the VIX averaged nearly 30 in 2020, which was only higher in calendar years 2009 and 2010. A VIX below 20 shows that broad and deep fear of the market is fading, paving the way for more buying – even if that buying follows a drop.
Who’s Happy?
The American Association of Individual Investors (AAII) Sentiment Survey had an exciting week. The percentage of investors reporting as bullish (i.e., happy about the stock market) jumped 8.1 percentage points to 45.5 percent. (That compares to its historical average of 38 percent). The bearishness level dropped 9.3 percentage points to 26.3 percent (compared to its historical average of 30.5 percent).
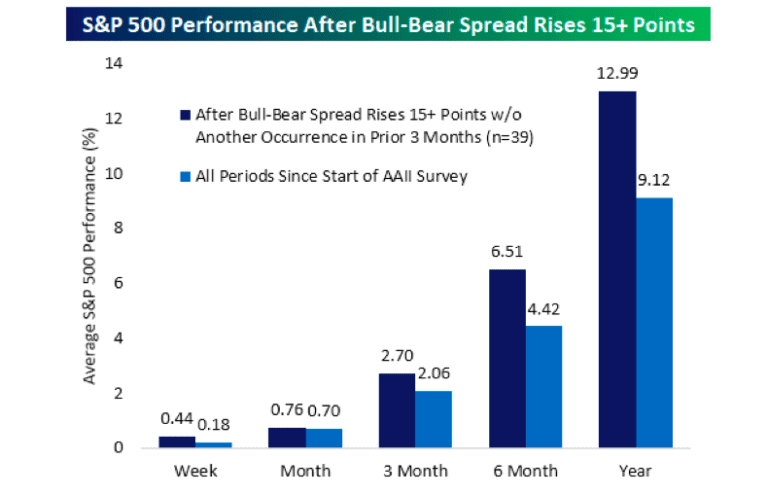
That was a 17.4 percentage point increase of the bull-bear spread. Going back to 1987, when the AAII began its survey, there were 223 prior weeks in which the bull-bear spread rose by at least 15 points in a week. The Bespoke Investment Group tracked those 223 instances. Bespoke broke it down even further to examine those times that did not also include a similar occurrence in the previous three months (which that most recent one did not). It turns out that, on average, the stock market performs well after those events.
As Bespoke shows in the graph below, it turns out that the S&P 500 has consistently traded higher during the next year following those instances, despite any corrections along the way.
I can easily make a case that the stock market is overvalued by a lot. And there are signs of froth and bubbles. I am concerned about how happy investors are because that typically limits the stock market’s upside potential. But that limit results from everyone who wants to own stocks already owning stocks, so there’s limited demand. However, investors can raise cash for stock-buying by selling bonds.
The idea that a pullback will entice investors to buy more stocks is a working theory. That theory is, in part, why I remain invested in equities. Instead of getting too defensive, I remain alert to pullbacks and expect any correction to be an opportunity to rebalance portfolios into something slightly more growth-oriented.
Allen Harris is the owner of Berkshire Money Management in Dalton, managing investments of more than $600 million. Unless specifically identified as original research or data-gathering, some or all of the data cited is attributable to third-party sources. Full disclosures: https://berkshiremm.com/capital-ideas-disclosures/. Direct inquiries to aharris@berkshiremm.com.
This article originally appeared in The Berkshire Edge on February 22, 2021

Allen is the CEO and Chief Investment Officer at Berkshire Money Management and the author of Don’t Run Out of Money in Retirement: How to Increase Income, Reduce Taxes, and Keep More of What is Yours. Over the years, he has helped hundreds of families achieve their “why” in good times and bad.
As a Certified Exit Planning Advisor, Certified Value Builder, Certified Value Growth Advisor, and Certified Business Valuation Specialist, Allen guides business owners through the process of growing and selling or transferring their established companies. Allen writes about business strategy in the Berkshire Eagle and at 10001hours.com.
Similar Posts
-

Recession or Not? Analysis by Allen Harris, October 2022

By Allen Harris
October 12, 2022 -

Unpopular Opinions in the Face of a Bear Market
By Allen Harris
June 22, 2022 -

S&P 500 Spiked 6.58% at June Rally | Impact on Index & Moving Averages
By Allen Harris
June 6, 2022