“It was the best of times, it was the worst of times … it was the season of light, it was the season of darkness, it was the spring of hope, it was the winter of despair.” — Charles Dickens
The year 2020 was dreadful. Our neighbors, friends, and family lost jobs as the economy struggled with COVID-19. Tragically, some of us lost loved ones to the virus. I keep those losses in mind as I review the year for the stock market. My intention isn’t to spike the ball in celebration of how well the stock market performed. Instead, it is my job to use that information to consider what investors might expect for the next 12 months.
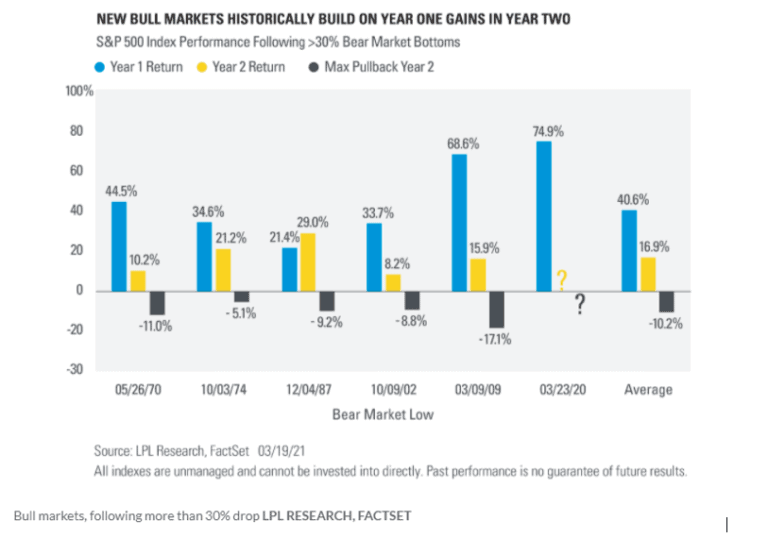
Last week, on March 23, 2021, the S&P 500 stock market index reached the one-year anniversary of its COVID-19 lows, having plunged 34 percent. The 12-month return on that date was a mammoth 74.78 percent, its best such stretch since 1936. On its way to achieving that return, in August 2020, the S&P 500 recorded its fastest recovery from a loss of more than 30 percent. For perspective, some of us remember Black Monday in 1987, which ultimately also became a 34 percent loss. It took 20 months – not five – to recapture the old highs.
What’s happens in the next 12 months? FactSet looked back over the last half-century to consider what happened after previous S&P 500 declines that exceeded 30 percent.
As you might suspect, the 12 months following a 30 percent decline has historically been phenomenal, averaging a gain of 40.6 percent. But that’s history. What will happen up until March 23, 2022? Historically, the year after, the S&P 500 experienced a 16.9 percent gain with a maximum pullback of 10.2 percent after similar bear markets followed by bull recoveries.
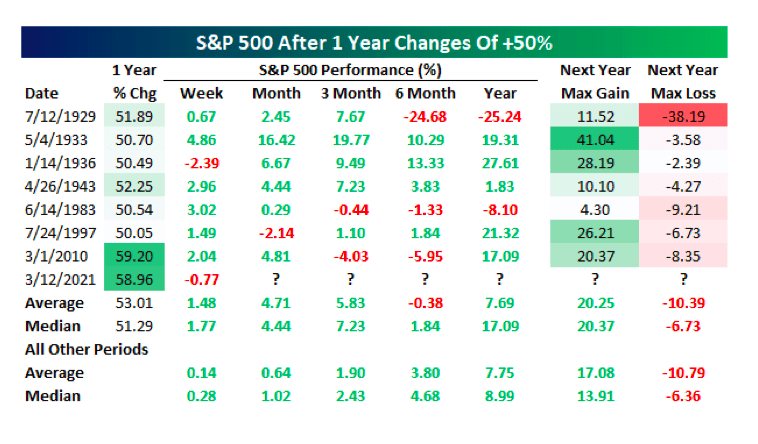
That’s not a lot of sample sizes, so let’s look at it a different way. Bespoke examined the times in which the S&P 500’s rolling one-year percent change first crossed a 50 percent gain, without another occurrence in the prior year. This most recently occurred on March 12, 2021.
Bespoke found that the average return following such advances was 17.08 percent for the year, with a maximum correction of 10.79 percent. Both close to FactSet’s findings.
Bespoke performed the screening for the NASDAQ 100 and the Russell 2000 stock market indices. However, they tracked the 12-month returns for these two after those indices were up greater than 75 percent. The NASDAQ 100’s average next-year gain was 28.90 percent, and the average maximum correction was 11.83 percent. For the Russell 2000, the average next-year return was 20.39 percent, with an average maximum correction of 11.91 percent.
I wouldn’t consider any of those years — or even the averages — to be a forecast for the next 12 months. I’ve been concerned that, after such stellar returns, the market might experience a reversion to the mean. A reversion to the mean, per Investopedia, “involves retracing any condition back to a previous state … any price that strays far from the long-term norm will again return, reverting to its understood state.” Or, in this instance, someone might say, “What goes up must come down.”
After the run the stock market has enjoyed, I’ve certainly thought about cashing in some chips. Of course, I review the fundamentals, consider valuations, and determine which investments might be favored over others. As I’ve shared with you in this column, due to that research, I am primarily invested in equities (where and for whom I’m supposed to be). However, as a thought exercise, I like to use historical tendencies as proof of concept for my fundamental conclusions. While I don’t rule out an eventual reversion to the means, the historical evidence is that I can somewhat comfortably maintain my bullish view.
Which stocks should you own for the next year? I’ve shared that I own small-cap stocks and a hedged position in emerging market (EM) stocks (both owned through exchange-traded funds, or ETFs). I’ve also shared that if there was a correction in the overall stock market, I’d expect small-caps and EMs to go down more than the broader market. I might use that as an opportunity to pick up some more.
I am also becoming more attracted to the stocks of companies involved with infrastructure development. I’ve held roughly a “market weight” position in these stocks, which is to say that I own passive ETFs that own these stocks. “Roughly” is probably too generous — it’s less than a market weight position. Holding an overweight position of, say, large-cap technology stocks, which I do, crowds out the infrastructure allocation. I allowed some stocks I like to take up a more prominent position in my portfolios, which means I must hold less of something else. Not because I didn’t like the sector, just because I preferred another industry more.
Now, I’m beginning to like the prospects of infrastructure development companies and am considering more direct exposure. As of when I was writing this column, I had not made a move, nor had I scheduled one. But I like to keep you abreast of my considerations. I don’t currently want to sell an investment I own to buy something else, but you might have cash you want to put to work.
President Biden’s administration is working on a $3 trillion infrastructure package. I want to re-type that because it even just looks like a typo — 3 trillion dollars. The crafting of the package could still be months off. I don’t yet know what such a package would look like or over how many years that money would be spent. Also, it may have trouble passing since the Republican side of the aisle recently opposed the $1.9 trillion American Recovery Plan (ARP) because it was too costly. The only way to pass the bill without the 60 votes typically needed in the Senate (which is evenly split) would be to go through the reconciliation process. That is how the ARP was passed without the Republican votes. So, yes, it can be done.
That massive infrastructure spending would be in addition to an economy that is getting back to normal. According to the CNN Business Back-to-Normal Index, the economy is operating at 86 percent of where it was in early March 2020. That reading marked the fourth consecutive week of growth, mirroring the U.S.’s progress with COVID-19 inoculations. As of March 24, 2021, 130 million doses had been given. In the week prior, an average of 2.49 million doses were administered per day.
That doesn’t mean that the government is ready to take its foot off the accelerator. Last week, Treasury Secretary Janet Yellen and Federal Reserve Bank Chair Jerome Powell held a joint session before the House Financial Services Committee as well as the Senate Banking Committee. Both acknowledged economic improvements while admitting that there was more work to do. Powell noted that “the recovery is far from complete, so, at the Fed, we will continue to provide the economy the support it needs for as long as it takes.”
The next correction for the stock market could be upwards of 5–15 percent, in line with the aforementioned historical averages. But the Fed and the Biden administration appear ready to support the economy should it begin to falter — or even if it doesn’t. The next 12 months could be the best of times for stocks.
Allen Harris is the owner of Berkshire Money Management in Dalton, Mass., managing investments of more than $700 million. Unless specifically identified as original research or data-gathering, some or all of the data cited is attributable to third-party sources. Unless stated otherwise, any mention of specific securities or investments is for illustrative purposes only. Adviser’s clients may or may not hold the securities discussed in their portfolios. Adviser makes no representations that any of the securities discussed have been or will be profitable. Full disclosures. Direct inquiries: aharris@berkshiremm.com.
This article originally appeared in The Berkshire Edge on March 29, 2021.
Allen is the CEO and Chief Investment Officer at Berkshire Money Management and the author of Don’t Run Out of Money in Retirement: How to Increase Income, Reduce Taxes, and Keep More of What is Yours. Over the years, he has helped hundreds of families achieve their “why” in good times and bad.
As a Certified Exit Planning Advisor, Certified Value Builder, Certified Value Growth Advisor, and Certified Business Valuation Specialist, Allen guides business owners through the process of growing and selling or transferring their established companies. Allen writes about business strategy in the Berkshire Eagle and at 10001hours.com.